Allowed Memory Size Exhausted: Where a WordPress Request's Memory Goes
Raising the memory limit hides the real question: what in this request needed that much? How to measure peak memory per request and per plugin, the autoload and transient costs every page pays, the PHP array shape that multiplies memory, and the unbounded queries behind most fatals.

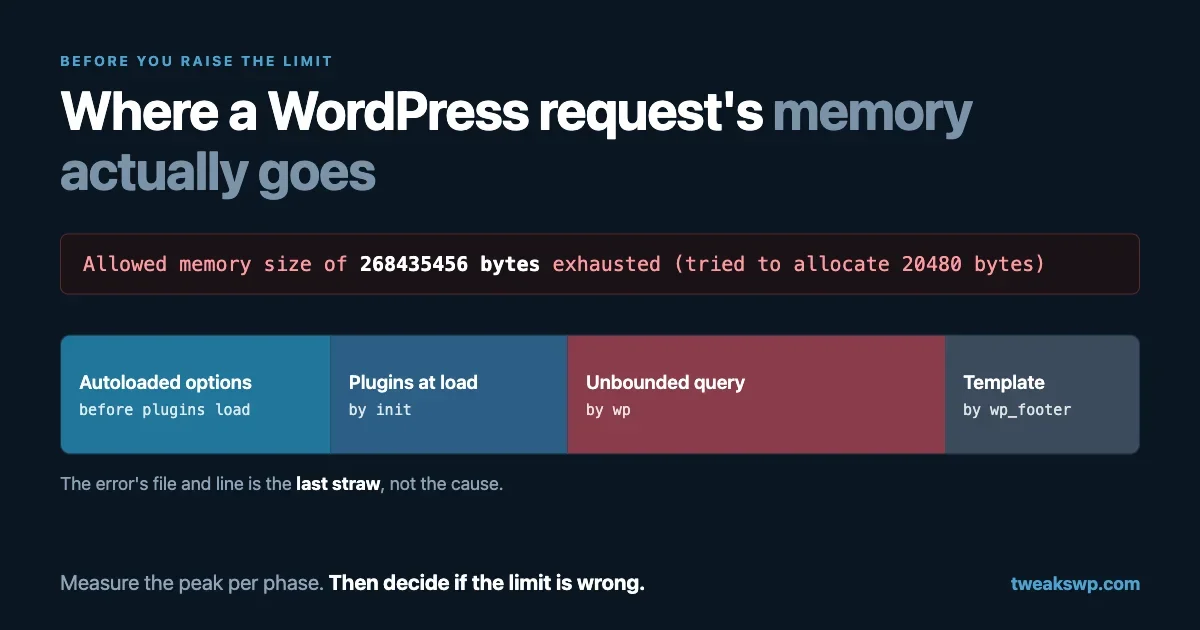
Fatal error: Allowed memory size of 268435456 bytes exhausted.
The standard fix is to raise the limit, and sometimes that is the right call. But raising it answers a different question from the one the error is asking. The error is not “is the limit high enough”. It is “what in this request needed a quarter of a gigabyte”, and on most WordPress sites nobody has ever measured the answer.
This post measures it: where memory goes in a WordPress request, the fixed costs every page pays before your code runs, a PHP array detail that can multiply memory by two and a half without any obvious change, and the patterns that make it explode on large sites.
Two numbers, and which one matters
PHP gives you two measurements, and they answer different questions.
memory_get_usage();          // memory in use right now
memory_get_peak_usage();     // the highest it has been this request
memory_get_peak_usage(true); // the same, counted in blocks the allocator reserved
The memory limit is checked against memory as it is allocated, so a request fails at its peak, not at its end. A request that briefly loads a huge result set and then frees it looks fine if you measure at the end, and dies anyway. Always measure the peak. Use true when comparing against memory_limit, since that is closer to what the limit sees.
Read the error message properly first
The full message carries more than the limit, and one part of it misleads people constantly:
PHP Fatal error: Allowed memory size of 268435456 bytes exhausted
(tried to allocate 20480 bytes) in /wp-includes/class-wpdb.php on line 2349
268435456 bytes is the limit in effect for that request, 256 MB. If you set a different value and this number did not change, your setting is not the one being applied, which is worth knowing before anything else.
Tried to allocate 20480 bytes is the size of the allocation that failed. A small number here is the normal case, and it tells you something useful: the request did not die because of one huge allocation. It had already used almost everything, and a tiny request pushed it over.
The file and line are where that last small allocation happened. That is the part that misleads. It is the last straw, not the cause. Seeing class-wpdb.php does not mean the database layer is broken; it means a query result was being built when memory ran out, and whatever filled memory before that is the real problem. The phase checkpoints above exist precisely because the error location almost never points at the culprit.
The one exception worth recognising: when the failed allocation is itself large, many megabytes rather than a few kilobytes, that single operation probably is the problem. A huge query result, an image being processed, or a large file read into memory will show up that way.
Measure a real request, not WP-CLI
It is tempting to measure from the command line:
wp eval 'echo size_format( memory_get_peak_usage( true ) ), PHP_EOL;'That number is real, but it describes a WP-CLI bootstrap: no theme template, no front-end hooks, no logged-in user. It is a useful floor and nothing more.
To see what an actual page costs, log it from inside the request. Drop this into wp-content/mu-plugins/request-memory.php on a staging copy:
<?php
/**
 * Log peak memory per request, with checkpoints. Staging only.
 */
if ( ! defined( 'WP_DEBUG' ) || ! WP_DEBUG ) {
    return;
}

$GLOBALS['tw_mem'] = array( 'start' => memory_get_usage() );

foreach ( array( 'plugins_loaded', 'init', 'wp', 'template_redirect', 'wp_footer' ) as $hook ) {
    add_action( $hook, function () use ( $hook ) {
        $GLOBALS['tw_mem'][ $hook ] = memory_get_usage();
    }, PHP_INT_MAX );
}

add_action( 'shutdown', function () {
    $m    = $GLOBALS['tw_mem'];
    $prev = $m['start'];
    $out  = array();
    foreach ( $m as $label => $bytes ) {
        $out[] = sprintf( '%s +%s', $label, size_format( max( 0, $bytes - $prev ) ) );
        $prev  = $bytes;
    }
    error_log( sprintf(
        '[mem] %s %s peak=%s | %s',
        is_user_logged_in() ? 'user' : 'anon',
        $_SERVER['REQUEST_URI'] ?? 'cli',
        size_format( memory_get_peak_usage( true ) ),
        implode( ' | ', $out )
    ) );
}, PHP_INT_MAX );
Load a few pages, logged in and logged out, then read the log:
grep '\[mem\]' wp-content/debug.log | tail -20If you already run Query Monitor on staging, its overview panel shows peak memory for the page you are looking at, which is the quickest single number to check. The logger above earns its place when you need the phase breakdown, or when you want numbers from many requests rather than the one in front of you.
Which plugin costs what at load time
When the big jump happens before init, the question becomes which plugin is responsible. WP-CLI can answer it by measuring the bootstrap once with everything active and then once per plugin with that plugin skipped:
base=$(wp eval 'echo memory_get_peak_usage(true);')
echo "all plugins: $base bytes"

for p in $(wp plugin list --status=active --field=name); do
  without=$(wp eval 'echo memory_get_peak_usage(true);' --skip-plugins="$p")
  echo "$(( base - without )) $p"
done | sort -rn | head -10
The output ranks plugins by how much peak memory disappears when each one is skipped. It is a WP-CLI measurement, so it captures what plugins do while loading rather than what they do while rendering a page, and plugins that depend on each other can produce odd numbers. Use it to decide where to look, not as a final verdict.
The checkpoints tell you which phase spent the memory. A large jump before plugins_loaded is core and options. A jump by init is plugins doing work at load time. A jump by wp is the main query. A jump by wp_footer is the template and everything it called. That split alone usually points at the culprit before you open a profiler.
Run it logged in and logged out separately. Page caching hides most front-end requests from PHP entirely, so the requests that actually hit the memory limit are nearly always the uncached ones: logged-in users, the admin, AJAX and REST.
The cost every request pays first: autoloaded options
Before any plugin code runs, WordPress loads every option marked for autoloading in one query and keeps it in memory for the whole request. That set is fixed per request, so it is the first thing to measure.
In WordPress 7.1 the autoload column can hold several values, and wp_autoload_values_to_autoload() treats four of them as “load this”:
$autoload_values = array( 'yes', 'on', 'auto-on', 'auto' );WP-CLI gives you the total directly:
wp option list --autoload=on --format=total_bytesAnd the largest individual offenders, from the database:
wp db query "SELECT option_name, LENGTH(option_value) AS bytes
  FROM $(wp db prefix)options
  WHERE autoload IN ('yes','on','auto-on','auto')
  ORDER BY bytes DESC LIMIT 20;"
Two thresholds in core are worth knowing when you read that list.
Site Health warns at 800,000 bytes. get_test_autoloaded_options() compares the total against a limit you can change with the site_status_autoloaded_options_size_limit filter, defaulting to 800000.
Large new options stop autoloading by default above 150,000 bytes. When an option is saved without an explicit autoload choice, wp_filter_default_autoload_value_via_option_size() checks its size against wp_max_autoloaded_option_size, which defaults to 150000. That protects you from new bloat. It does nothing about options that were saved with autoload switched on explicitly, or saved years ago.
Transients that never expire are autoloaded options
One source of autoload growth is easy to miss because the code that causes it never mentions autoloading. When a site has no persistent object cache, set_transient() stores the transient in the options table, and whether it autoloads depends entirely on the expiration:
if ( false === get_option( $transient_option ) ) {
    $autoload = true;
    if ( $expiration ) {
        $autoload = false;
        add_option( $transient_timeout, time() + $expiration, '', false );
    }
    $result = add_option( $transient_option, $value, '', $autoload );
}
A transient set with an expiration does not autoload. A transient set with no expiration, set_transient( 'my_cache', $data ), is added with autoload on, and is loaded into memory on every request from then on. If a plugin caches a large API response that way, it has quietly added that response to the fixed cost of every page.
Find them:
wp db query "SELECT option_name, LENGTH(option_value) AS bytes
  FROM $(wp db prefix)options
  WHERE option_name LIKE '\_transient\_%'
  AND option_name NOT LIKE '\_transient\_timeout\_%'
  AND autoload IN ('yes','on','auto-on','auto')
  ORDER BY bytes DESC LIMIT 20;"
Anything large in that list is a candidate for a fix in the code that sets it: give it an expiration. Deleting the row only removes it until the next time the code runs.
Bytes on disk are not bytes in memory
The LENGTH() figure is the serialized string. Once PHP unserializes it into arrays and objects, it takes considerably more room. To see what one option actually costs in memory, measure it:
wp eval '
global $wpdb;
$name = "the_big_option";
$raw  = $wpdb->get_var( $wpdb->prepare(
    "SELECT option_value FROM {$wpdb->options} WHERE option_name = %s", $name
) );

$before = memory_get_usage();
$value  = maybe_unserialize( $raw );
printf( "%s: %s on disk, %s in memory\n",
    $name, size_format( strlen( $raw ) ), size_format( memory_get_usage() - $before ) );
'
If an option is large and only used on one admin screen, it should not autoload. Change it for that option rather than for the whole table:
wp option set-autoload the_big_option offDo that one option at a time and test the screen that uses it. An option that is autoloaded because something reads it on every request gets slower, not faster, when it has to be fetched separately each time.
The array detail that multiplies memory
This is the part most WordPress developers have never had a reason to look at, and it explains a surprising amount of memory use.
A PHP array is one of two things internally. A packed array has integer keys 0, 1, 2 and so on in order, and PHP does not store the keys at all. A hash array stores every key, plus a hash and an index. Same syntax, very different cost.
Nazar Boyko measured the gap carefully in a benchmark on PHP 8.4.21, with a million integers:
packed list, keys 0..N-1 in order        16,781,392 bytes
same keys, filled in reverse order       41,943,120 bytes
after adding one string key to the list  +25,161,728 bytes
Filling the same array backwards made it two and a half times larger, because the keys arrived out of order and PHP had to build a hash table. Adding a single string key to a packed list converted all of it, for another 25 MB. And, from the same benchmark, removing that key does not convert it back. unset() frees the value and leaves the layout alone. array_values() builds a fresh packed array if you need one.
You will rarely hold a million integers. But the same rule applies to the arrays WordPress hands you, at smaller scale and far more often.
Where WordPress code builds hash arrays without meaning to
Rows as associative arrays. $wpdb->get_results( $sql, ARRAY_A ) returns a packed list of rows, but every row is its own hash array, with the column names stored as keys in every single row. The benchmark’s author found associative rows often use close to twice the memory of typed objects for large datasets. If you only need one column, $wpdb->get_col() returns a packed list of values with no per-row keys at all.
Keying a list by ID. The habit of re-indexing results for lookup:
$by_id = array();
foreach ( $posts as $post ) {
    $by_id[ $post->ID ] = $post;   // IDs are not 0..N-1, so this is a hash array
}
That is often exactly right, because lookups by ID are what you need. But if you only iterate, keep the list and skip the index. The lookup table is a second copy of the structure with a more expensive layout.
Building arrays in the wrong order. Collecting results in reverse, or inserting at computed offsets, produces a hash array even when the final keys are 0 to N. If you need a reversed list, build it forwards and call array_reverse(), which returns a new packed array.
Where requests actually explode
Fixed costs and array shapes explain a baseline. Memory limit errors usually come from something unbounded, and in WordPress the same few patterns account for most of them.
Unbounded queries
get_posts( array( 'posts_per_page' => -1 ) );
get_users();
new WP_Query( array( 'nopaging' => true ) );
Each of these loads every matching row into memory. On a site with two hundred posts, fine. On a site with two hundred thousand, the request dies, and it dies on the production site because staging had a fraction of the data. We covered this failure pattern in detail in Scaling WordPress to 50,000 rows.
Loading full objects when you need IDs
WP_Query loads full post objects by default, and then primes meta and term caches for every one of them. When you only need identifiers, say so:
$ids = new WP_Query( array(
    'post_type'              => 'post',
    'posts_per_page'         => 500,
    'fields'                 => 'ids',
    'no_found_rows'          => true,
    'update_post_meta_cache' => false,
    'update_post_term_cache' => false,
) );
'fields' => 'ids' returns a packed list of integers instead of objects. no_found_rows skips the count query used only for pagination. The two cache flags skip loading every meta row and every term relationship for posts you are not going to render. On a list of five hundred posts with heavy meta, the last two settings are frequently the largest saving in the whole query.
Long-running loops that never release anything
A WP-CLI command or cron job processing thousands of posts will grow steadily even if each iteration is small, because WordPress keeps everything it loads in its in-memory object cache for the rest of the request. The fix is to work in batches and clear that runtime cache between them:
$paged = 1;
do {
    $ids = get_posts( array(
        'post_type'      => 'post',
        'fields'         => 'ids',
        'posts_per_page' => 200,
        'paged'          => $paged++,
        'no_found_rows'  => true,
    ) );

    foreach ( $ids as $id ) {
        // process one post
    }

    wp_cache_flush_runtime();   // drop what this batch loaded
} while ( count( $ids ) === 200 );
wp_cache_flush_runtime() clears the in-memory cache for the current request without touching a persistent object cache’s stored data. Watch memory_get_usage() across batches: with the flush it stays flat, and without it the number climbs until the job dies partway through.
Where a persistent object cache helps, and where it does not
Adding Redis or Memcached changes where some of this data comes from, not how much of it a request holds once it arrives. The autoloaded options still end up in the request’s memory; they are just fetched from the cache instead of the database. A very large autoload set becomes one very large cache entry fetched on every request, which has its own costs, and is part of why we argued in Your Object Cache Is Not a Security Control that the cache should not be treated as a fix for what is stored in it.
Fix the size of the data first. Cache it second.
When raising the limit is the right answer
Sometimes the work is genuinely large, and the limit is simply too low for it: a big import, a report generator, image processing, an admin screen that legitimately assembles a lot of data. In those cases raise it, and raise the right constant. Admin screens use WP_MAX_MEMORY_LIMIT, not WP_MEMORY_LIMIT, and neither can exceed the server’s own memory_limit. Our guide to WP_MEMORY_LIMIT versus PHP memory_limit covers exactly how those three interact.
The test is whether you can say what the memory is for. “The monthly export builds a 40,000-row report” is a reason to raise the limit on the process that runs it. “The site started running out of memory” is a reason to run the measurement above first.
There is also a quieter cost to raising the limit everywhere. Under PHP-FPM, the memory limit is effectively the size of each worker’s worst case. Double it, and a server that could safely run twenty workers may now only be able to run ten before it swaps, which turns a memory error on one request into slowness on all of them.
Sites where logged-in traffic dominates
On a brochure site, almost every request is served from a page cache and PHP barely runs. Memory per request matters, but it matters on a handful of requests.
A community or learning platform inverts that. Members are logged in, so their pages are not cached, and every request builds activity feeds, member lists, notification counts or course progress from the database. The per-request cost is paid on nearly every page view, by every active user at once.
That is why bounded queries are a design decision rather than a tuning detail on those sites. In BuddyNext 1.2.0, for example, follower, following, connection and space-member lists moved to cursor-based paging for large communities, so a request holds one page of members rather than a whole membership list. Learnomy faces the same pressure with progress records across many students. We build both, so treat that as disclosure, but the principle is general: on a logged-in site, the number of rows a request can load should be bounded by design, not by the size of the data.
Checklist
- Measure peak memory per request on staging, logged in and logged out, with phase checkpoints.
- Check the autoload total with
wp option list --autoload=on --format=total_bytes, and list the twenty largest. - Measure large options in memory, not just on disk, before deciding what to change.
- Stop autoloading large options that are only used on specific screens, one at a time.
- Replace unbounded queries with paged ones, everywhere.
- Use
'fields' => 'ids'and switch off meta and term cache priming when you do not render the posts. - Prefer
get_col()over associative rows when you need one column. - Batch long jobs and call
wp_cache_flush_runtime()between batches. - Only then raise the limit, for the process that needs it, with a reason you can write down.
“Allowed memory size exhausted” is one of the few WordPress errors that tells you the exact number. The useful habit is to treat that number as a measurement to explain, not a threshold to move. Nine times out of ten, the explanation is one unbounded query or one oversized option, and fixing that is cheaper than every future request paying for a larger limit.
Plugins we build and run
We maintain these ourselves, which is why we can support them on your site.
- BuddyNextThe self-hosted community engine for WordPress
- BuddyXFree community theme, Pro when you outgrow it
- ReignPremium community theme. Add pieces, build anything
- JetonomyCommunity forum and Q&A for WordPress
- EventonomyEvents and RSVPs for WordPress communities
- LearnomyCourses and learning communities on WordPress
- ListoraDirectories and listings your members can browse
- SnipShareCode sharing built for developer communities
- WB Ad ManagerAd placements that turn traffic into revenue
- WP Career BoardA job board your community actually uses
- WP Sell ServicesSell services with offers, orders, and payouts
- MediaVersePhotos, video, and media albums for members
- WB GamificationPoints, badges, and rewards that keep members active
- Product RoadmapPublic roadmaps with voting your users trust