Your Object Cache Is Not a Security Control
Redis interfered with a recent WordPress exploit chain by accident, not by design. What a persistent object cache actually does, the four things it does not, and how to verify yours is correct rather than merely present.

During the recent WordPress core incident, a detail circulated that was technically accurate and dangerously easy to misread: sites running a persistent object cache such as Redis or Memcached may not have been exploitable through the full attack chain.
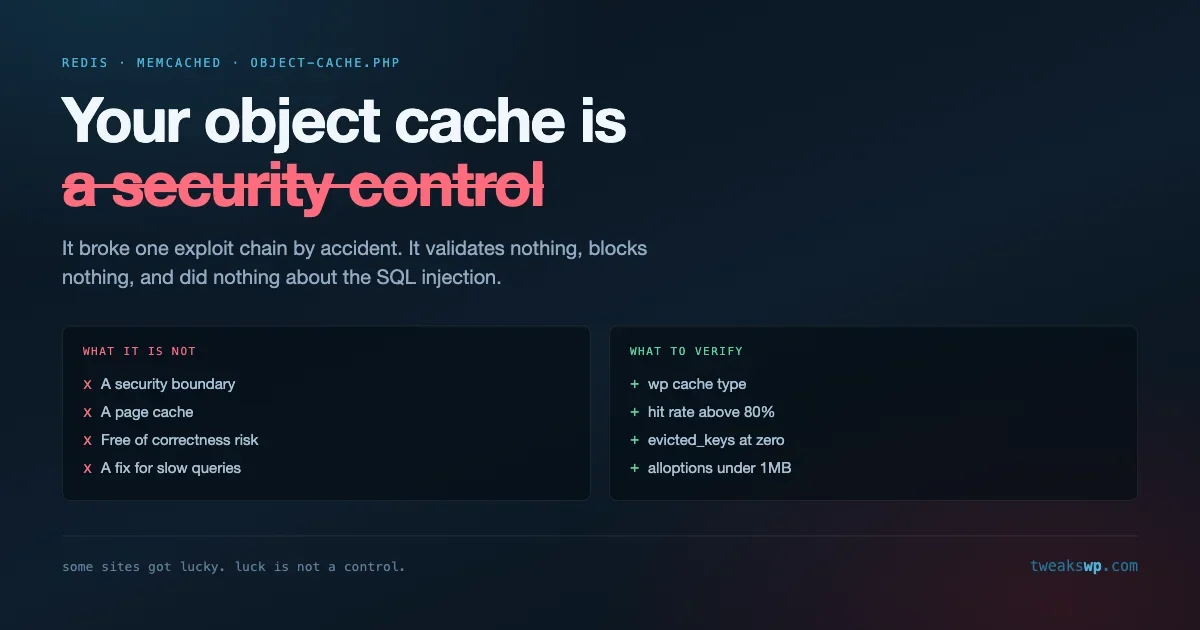
That is true. It is also not a security control, and treating it as one is how you end up unpatched and confident.
This is about what a persistent object cache actually does, the four things people believe it does that it does not, and how to verify yours is behaving correctly rather than assuming it is because the site feels fast.
What the object cache actually is
WordPress has an internal cache API. wp_cache_get() and wp_cache_set() store values in memory during a request so repeated lookups do not hit the database twice.
By default that memory is per request. The cache is populated at the start of the request and thrown away at the end. Every request rebuilds it from scratch.
A persistent object cache replaces that with a shared store that survives between requests. You drop an object-cache.php file into wp-content/, and the cache API starts talking to Redis or Memcached instead of a PHP array:
ls -la wp-content/object-cache.php
wp cache type
If wp cache type reports anything other than Default, a drop-in is active. That single fact changes the performance profile of the entire site, because query results, options, term relationships and post metadata all stop being rebuilt on every page view.
The four things it is not
It is not a security boundary
Start here because it is the one that prompted this article.
Why did a persistent object cache interfere with the recent exploit chain? Because the chain depended on a particular query path executing in a particular way, and a cache layer changed whether that code ran at all. A cached result meant the vulnerable path was skipped.
Read that carefully. The cache did not detect anything, block anything, or validate anything. It changed the timing and control flow of unrelated code, and that change happened to break one specific exploit. Nobody designed it, nobody tested it, and nobody can tell you it will hold for the next bug.
Concretely: it did nothing about the SQL injection half of that chain. A site with Redis and an unpatched core could still have its user table read. Password hashes leaving your database is a full incident on its own.
The correct summary is that some sites got lucky. Luck is not a control. Patch.
It is not a page cache
This confusion is constant and it produces real misconfiguration.
A page cache stores finished HTML and serves it without running PHP. An object cache stores intermediate values and still runs PHP on every request. They operate at different layers and solve different problems:
- Page cache helps anonymous traffic enormously and logged-in traffic not at all, because logged-in views are usually excluded.
- Object cache helps logged-in traffic, admin screens, WooCommerce carts, and REST endpoints, because those all run PHP and query the database regardless of any page cache.
A site with a page cache and no object cache has a fast front page and a slow admin. A site with both is doing the right thing. Someone who installs Redis expecting their front page to get faster, when a page cache was already serving it, will measure no improvement and conclude Redis does nothing.
It is not free of correctness risk
A cache that returns stale data is worse than no cache, because the failure is silent and intermittent. This is where most real object cache incidents come from, not from performance.
The common shapes:
- Cache not flushed on deploy. Code changes what a cached value means, the old value survives, and behaviour is inconsistent until something evicts it.
- Two sites sharing a Redis database. Without distinct key prefixes, one site reads the other’s cache. On staging and production sharing an instance, this is spectacular.
- Groups that should not be persistent. Some cache groups are request-local by design. Persisting them stores values that were never meant to outlive a request.
- Eviction under memory pressure. Redis configured with a
maxmemorypolicy will evict keys. If your code assumes a value it set is still there, it is assuming something the store never promised.
It is not a substitute for fixing queries
A cache in front of a bad query makes the bad query less frequent. It does not make it good, and the first request after every eviction pays full price.
If a page runs an unindexed query across 200,000 rows, caching the result means most visitors do not wait for it and some visitors wait the whole time. Under any traffic pattern that causes regular eviction, that is a slow site with good average numbers.
Verifying yours works
Start with whether the drop-in is actually active, since a file being present does not mean it loaded:
wp cache type
wp eval 'var_dump( wp_using_ext_object_cache() );'
Then confirm a round trip through the real store:
wp eval '
  wp_cache_set( "probe", "value-" . time(), "tweaks", 60 );
  var_dump( wp_cache_get( "probe", "tweaks" ) );
'
Run that twice a few seconds apart in separate commands. Each WP-CLI invocation is a separate PHP process, so if the second run returns the value written by the first, persistence is genuinely working. If it returns false or a fresh timestamp, you have a per-request cache wearing a Redis costume.
Check the store directly as well, because WordPress reporting success and Redis holding keys are two different claims:
redis-cli info keyspace
redis-cli --scan --pattern '*' | head -20
redis-cli info stats | grep -E 'keyspace_hits|keyspace_misses|evicted_keys'
The hit rate is the number that matters. Compute it as hits divided by hits plus misses. Below roughly 80 percent on a busy site, something is wrong: keys are being evicted, flushed too aggressively, or written with keys that never get read.
evicted_keys climbing steadily means Redis is under memory pressure and throwing away data you asked it to keep. That is a capacity problem, and no amount of WordPress configuration fixes it.
Key prefixes and the shared instance problem
If more than one site talks to the same Redis instance, they must not share a keyspace. The usual mechanism is a salt or prefix constant:
wp config set WP_CACHE_KEY_SALT 'site-a-prod:'
wp config get WP_CACHE_KEY_SALT
Verify the separation rather than trusting it, by looking for your prefix in the actual keyspace:
redis-cli --scan --pattern 'site-a-prod:*' | head -5
redis-cli --scan --pattern 'site-b-prod:*' | head -5
Better still, give each site its own Redis database index, which makes cross-contamination structurally impossible rather than merely unlikely:
wp config set WP_REDIS_DATABASE 2 --rawThe failure this prevents is memorable. Two sites sharing a keyspace will serve each other’s cached options, which can mean one site rendering another’s site title, or worse, one site’s user session data being read by the other. Staging sharing production’s Redis is the version of this that reaches customers.
The alloptions problem
There is one cached value large enough to deserve individual attention: alloptions.
WordPress loads every option marked autoload = yes on every request, as a single cache entry. On a healthy site that is perhaps 100KB. On a site where plugins have been storing serialised data in autoloaded options for years, it can be several megabytes.
Check yours:
wp eval 'echo size_format( strlen( serialize( wp_load_alloptions() ) ) );'Anything over about 1MB is worth investigating. Find the offenders:
wp db query "
  SELECT option_name, ROUND(LENGTH(option_value)/1024) AS kb
  FROM wp_options
  WHERE autoload = 'yes'
  ORDER BY LENGTH(option_value) DESC
  LIMIT 20;
"
A large alloptions is worse with an object cache than without one, which is counterintuitive enough to catch people out. Every request fetches the entire blob over the network from Redis, deserialises it, and throws most of it away. A 5MB alloptions fetched on every request is 5MB of network transfer and deserialisation per page view.
Fix it by turning off autoload for the entries that do not need it:
wp db query "
  UPDATE wp_options SET autoload = 'no'
  WHERE option_name = 'some_huge_transient_like_option';
"
wp cache flush
Take a database export before touching options, and change one at a time. An option that genuinely needs autoloading will produce a site that queries for it on every request instead, which is a different problem rather than a fix.
Flushing correctly
The blunt instrument works and is usually wrong on a shared instance:
wp cache flushThat empties the whole store. On a dedicated database index for one site, fine. On a shared instance without proper separation, you have just flushed every site on that server, and they will all hit the database simultaneously to rebuild. The resulting stampede can be worse than whatever prompted the flush.
Prefer targeted invalidation where the API supports it:
wp cache delete alloptions options
wp eval 'wp_cache_delete( 12345, "posts" );'
And build the flush into your deployment rather than doing it by hand, because a deploy that changes code without flushing is the most common source of stale-cache bugs:
#!/bin/bash
# post-deploy.sh
wp cache flush
wp eval 'var_dump( wp_cache_get( "probe", "tweaks" ) );'
curl -s -o /dev/null -w 'front page: %{http_code}\n' https://example.com/
The probe check afterwards matters. A flush that leaves the cache unreachable, because Redis restarted or credentials changed, produces a site that silently falls back to the database for everything. It stays up and gets slow, which is a failure mode nobody has an alert for.
Non-persistent groups, and why they exist
Not every cache group should survive a request, and WordPress knows this. Some groups are registered as non-persistent, which tells the drop-in to keep them in the per-request array even when an external cache is available.
wp eval '
  global $wp_object_cache;
  print_r( array_keys( (array) $wp_object_cache->no_mc_groups ?: [] ) );
'
The names vary between drop-ins, so check your implementation rather than assuming. The concept is universal: groups like counts, plugins and some user-session-adjacent data are deliberately request-scoped.
The reason matters. A value is safe to persist when it is derived from data you can invalidate reliably. It is unsafe when it depends on request context, when invalidation is unreliable, or when serving a stale copy has consequences worse than the cost of recomputing it.
If you register your own groups, think about that boundary explicitly:
// Safe to persist: derived from post data, invalidated on save_post
wp_cache_add_global_groups( array( 'my_plugin_reports' ) );

// Not safe to persist: depends on the current request
wp_cache_add_non_persistent_groups( array( 'my_plugin_request_state' ) );
Getting this wrong produces the worst class of caching bug, where one user sees another user’s data. That happens when something request-scoped, typically keyed by current user, gets persisted into a shared store under a key that does not include the user. The site works perfectly in testing with one user and fails in production with two.
The rule that avoids it: if the value would be different for a different logged-in user, either the key includes the user ID or the group is non-persistent. There is no third option that is safe.
Cache stampede, and the first request after a flush
Every cache has a worst moment, and for an object cache it is the instant after a flush on a busy site.
The mechanic is simple. A hundred concurrent requests all look for a value, all miss, and all run the expensive query that populates it. Instead of one slow request you get a hundred, arriving simultaneously, against a database that was sized on the assumption the cache would absorb most of that load.
You can watch it happen:
wp cache flush && wp db query "SHOW STATUS LIKE 'Threads_running';"
watch -n1 "mysql -e \"SHOW STATUS LIKE 'Threads_running';\""
A spike in running threads immediately after a flush is the stampede. On a site with enough traffic it is the difference between a fast site and a database refusing connections.
Three mitigations, in order of how much work they cost:
- Flush during low traffic. Free, and adequate for most sites.
- Avoid full flushes. Delete the keys the deploy actually invalidated instead of everything.
- Stagger expiry. Where you set your own TTLs, add jitter so a batch of values written together does not expire together.
// Without jitter, everything written this second expires the same second
wp_cache_set( $key, $value, 'my_group', HOUR_IN_SECONDS );

// With jitter, expiry spreads across a five minute window
wp_cache_set( $key, $value, 'my_group', HOUR_IN_SECONDS + wp_rand( 0, 300 ) );
The jitter trick costs one function call and removes a whole category of synchronised-expiry incident. It is most valuable for values populated in bulk, such as anything primed by a cron job that runs over many posts at once.
Monitoring it like infrastructure
An object cache is a dependency, and dependencies need monitoring rather than optimism. Three signals cover most of it.
Is it reachable? The important failure is not Redis crashing, which is loud. It is WordPress silently falling back to the database:
wp eval 'echo wp_using_ext_object_cache() ? "external" : "FALLBACK";'Run that on a schedule and alert on FALLBACK. A site that has quietly dropped to the default cache is running with a performance profile nobody planned for.
Is the hit rate healthy? Track hits and misses over time rather than reading them once:
redis-cli info stats | grep -E 'keyspace_(hits|misses)'A hit rate that falls suddenly usually means either a deployment changed key generation or memory pressure started evicting.
Is it evicting?
redis-cli info memory | grep -E 'used_memory_human|maxmemory_human'
redis-cli info stats | grep evicted_keys
Any non-zero eviction count on a cache sized for your working set means it is not sized for your working set.
When not to use one
Worth saying, because the default advice is always to add one.
A low-traffic brochure site with a page cache in front of it gets very little from a persistent object cache. Almost all its traffic is anonymous and served as cached HTML, PHP barely runs, and you have added a network dependency, a failure mode and an operational surface for a benefit measured in milliseconds on the admin screens two people use.
The sites that genuinely benefit share a shape: substantial logged-in traffic, heavy admin use, WooCommerce or membership functionality that bypasses page caching, or a REST API under real load. If none of those describe your site, the honest answer is that your money and attention are better spent elsewhere.
Our step-by-step Redis setup guide covers the installation properly if you have decided you are in the first category. The decision of whether to be in it is separate from the mechanics of getting there.
Questions people are asking
Does an object cache protect me from SQL injection?
No. It can incidentally change whether a specific vulnerable code path executes, which is what happened during the recent core incident, but it validates nothing and blocks nothing. The injection half of that chain worked regardless. Patching is the control, as covered in our writeup of the wp2shell chain.
Redis or Memcached?
For most WordPress sites the difference is not worth agonising over. Redis has richer data structures, better persistence options and a healthier ecosystem of WordPress drop-ins, which is why it is the common default. Memcached is simpler and entirely adequate. Pick based on what your hosting already runs well.
Do I need both a page cache and an object cache?
Most non-trivial sites do, because they solve different problems. The page cache handles anonymous traffic, the object cache handles everything that runs PHP. Neither substitutes for the other.
My hit rate is 60 percent. Is that bad?
It is worth investigating rather than panicking. Common causes are memory pressure causing eviction, an aggressive flush on every deploy or cron run, or cached values with very short expiry. Check evicted_keys first, since that is the cause with the clearest fix.
Does an object cache help or hurt during a traffic spike?
Helps, provided it was warm before the spike started. A cache that is already populated absorbs load that would otherwise reach the database, which is the entire point. A cache that is cold when traffic arrives is worse than useless for the first wave, because every request pays the miss cost and they all pay it at once. This is why the timing of a flush matters more than the flush itself, and why priming matters for predictable events like a campaign launch.
What happens if Redis goes down while the site is running?
A well-behaved drop-in falls back to the per-request cache and the site keeps serving, slower. That is the good case and it is also the dangerous one, because nothing visibly fails. Sites have run for weeks in fallback after a Redis restart that nobody noticed, with the performance regression attributed to traffic growth. The check for wp_using_ext_object_cache() above exists precisely for this.
Should I flush the cache on every deploy?
Yes for a deploy that changes code, no for a content change. And on a shared Redis instance, flush your own keyspace rather than the whole store.
Can I run WordPress cron and object caching together safely?
Yes, with one caveat. A long-running cron process holds cache state from when it started, so a job that runs for minutes can act on values that changed underneath it. For jobs that matter, re-read rather than trusting values fetched at the top of the run.
Your checklist
- Confirm the drop-in is active with
wp cache type, not by checking the file exists. - Prove persistence across two separate WP-CLI invocations.
- Set
WP_CACHE_KEY_SALT, or better, a dedicatedWP_REDIS_DATABASEper site. - Measure
alloptionsand reduce it if it is over 1MB. - Check
evicted_keysis zero and hit rate is above 80 percent. - Put a cache flush in your deploy script, followed by a probe.
- Alert on silent fallback to the default cache.
- Patch your core regardless of what your cache layer happens to prevent.
The reason to treat this carefully is that an object cache is the rare piece of infrastructure whose failures make the site slower rather than broken. Nothing errors. Nothing alerts. The site simply stops being fast, gradually, and the person who set it up two years ago has left. Verification is cheap and the alternative is not noticing.
Plugins we build and run
We maintain these ourselves, which is why we can support them on your site.
- BuddyNextThe self-hosted community engine for WordPress
- BuddyXFree community theme, Pro when you outgrow it
- ReignPremium community theme. Add pieces, build anything
- JetonomyCommunity forum and Q&A for WordPress
- EventonomyEvents and RSVPs for WordPress communities
- LearnomyCourses and learning communities on WordPress
- ListoraDirectories and listings your members can browse
- SnipShareCode sharing built for developer communities
- WB Ad ManagerAd placements that turn traffic into revenue
- WP Career BoardA job board your community actually uses
- WP Sell ServicesSell services with offers, orders, and payouts
- MediaVersePhotos, video, and media albums for members
- WB GamificationPoints, badges, and rewards that keep members active
- Product RoadmapPublic roadmaps with voting your users trust