Six WordPress Performance Problems PageSpeed Will Never Show You
PageSpeed Insights sends no cookies and never logs in, so it misses the slowest WordPress problems. Six of them, with the commands to measure each and the smallest fix.

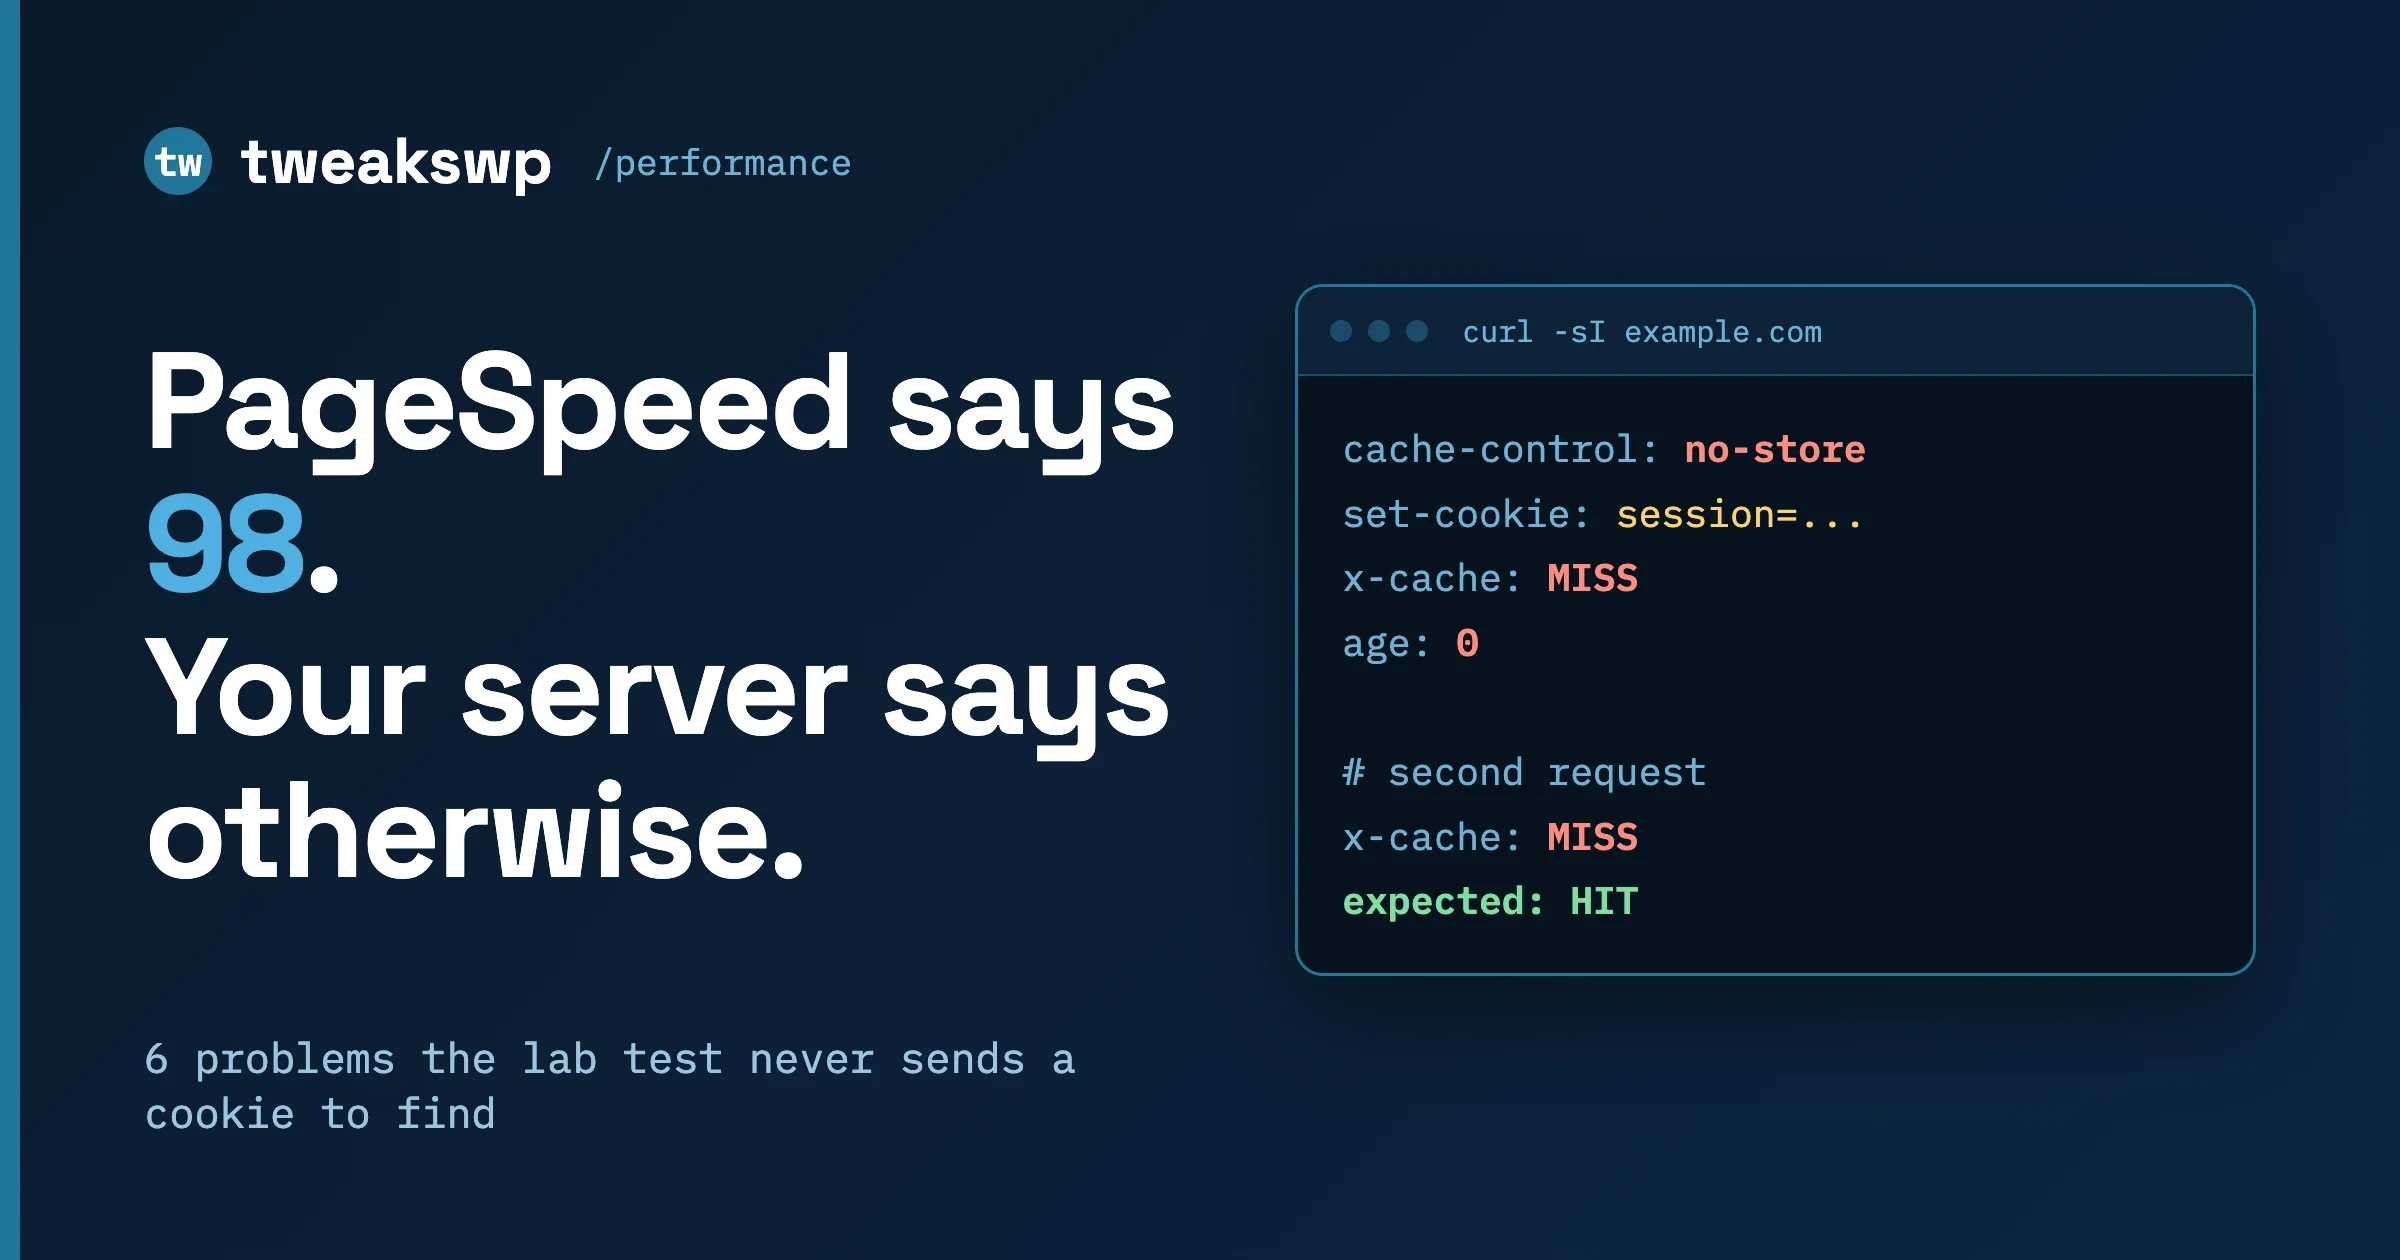
PageSpeed Insights tests one anonymous page load from a clean browser. It sends no cookies, never logs in, never opens wp-admin, and does not watch what runs in the background. That is why a WordPress site can score 95 on mobile and still feel slow to the people who use it, and why the most expensive performance problems rarely appear in its report. This guide covers six WordPress performance problems of that kind, how to measure each one from the command line or the server logs, and the smallest fix that works.
Fixing WordPress performance problems starts with measuring the requests PageSpeed skips. The first problem is the one that costs the most money: a caching or optimisation plugin that quietly stops your host’s cache from doing its job. The other five WordPress performance problems are logged-in page views, admin-ajax and the Heartbeat API, cron and Action Scheduler backlogs, autoloaded options, and uncached search.
Each of these comes up again and again in WordPress and hosting discussions, and each section gives you the command to measure it on your own site, so you work from your own numbers rather than someone else’s.
Why does PageSpeed Insights miss real WordPress performance problems?
Because it measures the cheapest request your site will ever serve. An anonymous visitor with no cookies is exactly the request a page cache is built to answer, so the lab test mostly measures your cache and your front-end assets. The expensive requests come from other places:
- Logged-in users, whose requests skip the page cache by design.
- Background requests that run on a timer and never render a page.
- Requests with a cookie or query string that make the cache treat them as unique.
- Work that happens on every request regardless of the page, such as loading options from the database.
None of those show up in a single anonymous page load. The tools that do show them are your access logs, response headers, WP-CLI and the database. The rest of this post uses those.
Can a caching plugin switch off my host’s cache?
Yes, it can end up that way, and it is easy to miss because the site still works and the plugin reports healthy numbers. If the response your server sends carries headers or cookies that tell the host’s cache not to store the page, every visit reaches PHP and the database even though a fast edge or server cache is sitting in front of the site. You pay for that in CPU, in response time and, on metered plans, in bandwidth.
This is a mechanism, not a verdict on any product. Anything in your stack that sets Cache-Control: no-store, private or no-cache, sets a cookie on anonymous requests, adds a Vary: Cookie header, or replaces the host’s page cache integration can produce the same result. A plugin that installs its own page cache and then manages cache headers itself is one place to look. A security or membership plugin that starts a session for every visitor is another. WooCommerce and multilingual plugins are a third, because they legitimately set cookies and the rules need to be narrow, as the post on cookies quietly bypassing your page cache explains.
What is the three-header check that shows which cache served a page?
Request the page twice with curl and read three things in the response: the cache-control policy, a hit-or-miss indicator, and the object age. Header names for the indicator differ by host and CDN, so look for whichever your stack sends.
curl -sI -H 'Accept-Encoding: gzip' https://example.com/ \
  | grep -iE '^(cache-control|age|x-cache|x-cache-status|cf-cache-status|x-proxy-cache|x-litespeed-cache|set-cookie|vary|expires):'

# run it twice, a few seconds apart, and compare
Read the result like this:
- Cache-Control.
public, max-age=...means the page may be stored.no-store,privateorno-cache, must-revalidate, max-age=0on an anonymous page means something told every cache to skip it. - Hit or miss header. The second request should say HIT (or the equivalent). If both requests say MISS, BYPASS or DYNAMIC, no cache in front of PHP is storing the page.
- Age. An
Ageheader that grows between your two requests means a cache is serving the same stored copy. If it is missing or stays at 0, nothing is.
Also look for Set-Cookie on an anonymous request. A cookie on a plain page view is one of the most common reasons a cache refuses to store a page. Check it with no cookies sent, which is how a first-time visitor and a crawler arrive.
If the page is a miss every time, turn off optimisation plugins one at a time on a staging copy and repeat the check. When the headers change, you have found the cause. Then look in that plugin’s settings for options about cache headers, host integration, or sending nocache headers, and read what each one does before changing it.
How do you measure bandwidth by path?
Your access log already knows where the bytes go. On an nginx or Apache log in the default combined format, the request path is field 7 and the response size in bytes is field 10, so you can total bytes per path and sort. Adjust the field numbers if your log format differs.
awk '{ bytes[$7] += $10; hits[$7]++ }
     END { for (p in bytes) printf "%12d %8d %s\n", bytes[p], hits[p], p }' \
  /var/log/nginx/access.log | sort -rn | head -25

# group by file extension instead of full path
awk '{ split($7, a, "?"); n = split(a[1], b, "."); ext = (n > 1) ? b[n] : "(none)";
       bytes[ext] += $10 } END { for (e in bytes) printf "%12d %s\n", bytes[e], e }' \
  /var/log/nginx/access.log | sort -rn | head
Two readings matter. If the top entries are images, video or downloads, your bandwidth problem is assets and a CDN or compression fixes it. If the top entries are HTML pages, cart or checkout paths, or /?s= and admin-ajax.php, the cost is dynamic requests that a working cache should have absorbed, and the caching check above is where to go next. Compare yesterday’s total against the same path totals after you change something, so you can tell whether the fix did anything.
Tested the three awk and grep pipelines on a sample combined-format log with macOS awk, October 2026. Log formats vary, so confirm the field numbers with head -1 access.log first.
Why are logged-in page views slow when the front end is fast?
Because a logged-in request cannot be served from a page cache, so every view runs the full PHP and database path. Page caches skip any request that carries a login cookie, since the page can differ per user (the admin bar, a cart, a member-only block). A site that is fast for visitors and sluggish for editors, customers or members is almost always showing you this gap.
Measure it on the request that matters. Query Monitor shows the breakdown for the page you are looking at. For a repeatable command-line figure, the WP-CLI profile package times each stage of a request as a chosen user:
wp package install wp-cli/profile-command
wp profile stage --user=1 --url=https://example.com/my-account/
wp profile hook --user=1 --url=https://example.com/my-account/ --spotlight
The stage output splits time into bootstrap, main query and template. The hook output shows which hooks and callbacks cost the most. The fixes are the ones from the other posts on this site: cut slow queries (find and fix the queries killing your site), put a persistent object cache behind the request so repeated lookups stay in memory, and check where a request’s memory and time go (allowed memory size exhausted). For high first-byte times on uncached requests, the TTFB optimisation checklist covers PHP and server settings.
Do not try to page-cache logged-in pages by loosening cookie rules. That is how one member’s account page ends up served to another. Make the dynamic path fast instead, and cache only the fragments that are safe to share.
Is admin-ajax or the Heartbeat API slowing my site down?
It can be. Every call to admin-ajax.php boots all of WordPress and bypasses the page cache, and the Heartbeat API sends one on a timer from open editor and dashboard tabs. A few editors with tabs left open all day produce a steady stream of full WordPress boots that no one sees, and plugins that poll through admin-ajax from the front end multiply it for every visitor.
Count the requests first. The log cannot show the AJAX action name because it travels in the POST body, but volume and timing are enough to spot a problem:
# requests per hour to admin-ajax.php
grep 'admin-ajax.php' /var/log/nginx/access.log \
| awk '{ print substr($4, 2, 14) }' | sort | uniq -c | sort -rn | head
# how much of all traffic is admin-ajax
echo "admin-ajax: $(grep -c 'admin-ajax.php' /var/log/nginx/access.log) total: $(wc -l < /var/log/nginx/access.log)"If admin-ajax is a meaningful share of requests, find the callers in the browser’s Network tab, filtered to admin-ajax.php, and read the action value in each request payload. The post on debugging WordPress AJAX requests walks through that.
For Heartbeat, the least invasive change is to lengthen the interval with the documented heartbeat_settings filter, instead of switching Heartbeat off, because the editor uses it for autosave and post locking:
add_filter( 'heartbeat_settings', function ( array $settings ): array {
    $settings['interval'] = 60; // seconds; WordPress accepts 15 to 120.
    return $settings;
} );
The filter callback syntax-checks and returns the expected array on PHP 8.5, October 2026; test the effect on a staging site by watching the Network tab for the Heartbeat request interval. The Heartbeat API handbook page describes what else depends on it.
How do cron and Action Scheduler backlogs hurt performance?
A backlog of due jobs means work piles up behind each page load. WordPress cron by default runs when a visitor arrives, so a long queue of due events can add latency to real requests, and a stuck queue can keep failing and retrying forever. PageSpeed cannot see any of it because the jobs run outside the page it measures.
Check what is due and what is overdue:
wp cron event list --fields=hook,next_run_relative --format=table | head -30
wp cron event run --due-now

# Action Scheduler queue by status (the table exists when a plugin bundles it)
wp db query "SELECT status, COUNT(*) AS n FROM wp_actionscheduler_actions GROUP BY status"
Many pending or failed rows, or events overdue by hours, mean the runner is not keeping up. The standard fix is to stop relying on visitor-triggered cron. Set define( 'DISABLE_WP_CRON', true ); in wp-config.php and call wp-cron.php from a real system cron every minute or two, as the cron handbook describes. Action Scheduler then runs on that same trigger. If a single job type is failing over and over, fix or remove that job instead of raising limits.
This topic has more depth than one section can carry, so this section stays short. Action Scheduler deserves a deeper guide of its own.
Are autoloaded options making every request heavier?
Yes, when the autoloaded set is large. WordPress loads every option flagged for autoload in a single query at the start of each request and holds the result in memory, whether the page needs those options or not. Abandoned plugins often leave large rows behind, and a few hundred kilobytes there is added to every request, including the cached-miss ones that PageSpeed never sees.
List the largest autoloaded rows:
wp db query "SELECT option_name, LENGTH(option_value) AS bytes
FROM wp_options
WHERE autoload IN ('yes','on','auto','auto-on')
ORDER BY bytes DESC LIMIT 15"

wp db query "SELECT COUNT(*) AS rows, SUM(LENGTH(option_value)) AS total_bytes
FROM wp_options WHERE autoload IN ('yes','on','auto','auto-on')"
The query lists the autoload values used by WordPress 6.6 and later (on, auto, auto-on) alongside the older yes. Run it on staging first. The Site Health screen also has a check for the size of autoloaded options and flags it when it grows large.
For each big row, find out which plugin owns it. If the plugin is gone, delete the option. If the plugin is active but only uses the option on one screen, set it not to autoload with wp option set-autoload option_name off after testing on staging, because a plugin that expects the option to be preloaded will then pay one extra query when it reads it. The fuller write-up is in the post on where a request’s memory goes, which treats autoload and transients as per-request costs.
Why does WordPress search slow the site even with caching on?
Because every distinct search term is a new URL, so a page cache never has the answer, and the default search runs a LIKE '%term%' scan over post titles and content. Nothing in a lab test touches it. On a real site, bots and scrapers hit /?s= with endless random strings, and each one is a full uncached query.
See how much of your traffic it is:
grep -c '[?&]s=' /var/log/nginx/access.log
grep '[?&]s=' /var/log/nginx/access.log | awk '{ print $1 }' | sort | uniq -c | sort -rn | head
A small number of addresses producing thousands of search requests is the pattern to look for. Three fixes, in order of effort:
- Rate limit search at the server. The nginx fragment below limits only requests that carry a search term, because nginx does not count requests whose limit key is empty.
- Keep crawlers out of search results pages. Add
Disallow: /?s=andDisallow: /search/torobots.txt. This stops well-behaved crawlers; it does nothing against abusive ones, which is why the rate limit comes first. - Replace the default search for large sites. If real users search a lot, a dedicated search index returns better results than
LIKEscans and takes the load off MySQL.
# http {} context
map $arg_s $search_key {
    default "";
    "~."    $binary_remote_addr;
}
limit_req_zone $search_key zone=wpsearch:10m rate=12r/m;

# server {} context, inside location / { ... }
limit_req zone=wpsearch burst=5 nodelay;
limit_req_status 429;
We have not run this exact fragment on a live server. Check it with nginx -t before reloading, and keep the rate generous enough that a real person typing a few searches a minute is never blocked.
Which cookies and headers should you look for first?
When the three-header check shows a miss, the usual suspects are small and specific. Write down what you find before you change any rule, because the goal is a narrow exception, not a wider hole.
- A session or tracking cookie on anonymous requests. Any
Set-Cookieon a plain page view, especially one that is unique per visitor, makes many caches skip the page. - WooCommerce cookies. WooCommerce sets cart and session cookies such as
woocommerce_items_in_cart,woocommerce_cart_hashandwp_woocommerce_session_*. Those are meant to bypass the cache on cart, checkout and account pages. They should not be present for a visitor who has not added anything to a cart. - A language cookie. Multilingual plugins can store the visitor’s language in a cookie. If the cache rules treat that cookie as a bypass, every visitor who has chosen a language skips the cache. Language should usually be part of the cache key through the URL, not a bypass.
- A
Vary: Cookieheader. This tells caches to store a separate copy per cookie value, which for a unique cookie means no reuse at all. - A nocache header added by a plugin. Search the plugin and theme code for
nocache_headers()andheader( 'Cache-Control. Core usesnocache_headers()for screens such as login and admin, so what matters is whether anything calls it for anonymous front-end pages.
Once you know which one it is, the fix is almost always to narrow a rule: exclude only the paths that need to be dynamic, and exclude the cookie only when it carries state that changes the page. The linked post on cookie bypass rules covers how to rewrite them without losing the hit rate.
How do you prove a fix worked?
Re-run the same measurement under the same conditions, and compare it with the number you wrote down. A cache fix should show a HIT on the second request and a lower server response time on repeat visits. A bandwidth fix should show the path total falling in the next day’s log. A background-job fix should show an empty or shrinking overdue list. If the metric did not move, the change was not the cause, and you should undo it instead of stacking another change on top. Keep one change per measurement; two fixes at once leave you unable to say which one helped.
When is a clean PageSpeed score enough?
For a small brochure site with no logins, no cart, no search box people actually use, and a host that serves cached pages, an anonymous lab score is close to the whole story. Most of this post does not apply to you, and the right move is to leave it alone. The problems here grow with logged-in users, plugins that talk to the server in the background, WooCommerce and membership features, and traffic you did not invite. If you run any of those, a green report is the start of the check, not the end of it.
What should you do first?
Run them in order of cost and effort, and write the numbers down before you change anything so you can prove the fix helped:
- Run the three-header check against your home page and your top landing page. If both requests miss the cache, find what changed the headers.
- Total bandwidth by path from yesterday’s log. Decide whether assets or dynamic requests dominate.
- Profile one logged-in page with
wp profile stage. - Count admin-ajax requests per hour, and lengthen the Heartbeat interval if editors keep tabs open.
- Check cron and Action Scheduler for overdue work, and move cron to a system timer.
- List the ten largest autoloaded options and the search request count.
Each step takes minutes and needs no new plugin. If you would rather have someone run this audit for you on a live store or membership site, Wbcom Designs lists its WordPress services on its services page.
The same pattern runs through all six problems: the request PageSpeed measures is not the request your users or your server pay for. Measure the other ones.
Plugins we build and run
We maintain these ourselves, which is why we can support them on your site.
- BuddyNextThe self-hosted community engine for WordPress
- BuddyXFree community theme, Pro when you outgrow it
- ReignPremium community theme. Add pieces, build anything
- JetonomyCommunity forum and Q&A for WordPress
- EventonomyEvents and RSVPs for WordPress communities
- LearnomyCourses and learning communities on WordPress
- ListoraDirectories and listings your members can browse
- SnipShareCode sharing built for developer communities
- WB Ad ManagerAd placements that turn traffic into revenue
- WP Career BoardA job board your community actually uses
- WP Sell ServicesSell services with offers, orders, and payouts
- MediaVersePhotos, video, and media albums for members
- WB GamificationPoints, badges, and rewards that keep members active
- Product RoadmapPublic roadmaps with voting your users trust